The problem
Hospitals carry a lot of unpaid patient bills. If you can flag which patients are likely to end up
in financial difficulty, a billing team can step in early with a payment plan or support, instead
of chasing a debt months later. This is a ranking problem: surface the high-risk group at the top.
I built it on synthetic EHR data from Synthea, so it is a working demonstration of the pipeline
rather than a deployed tool.
The model
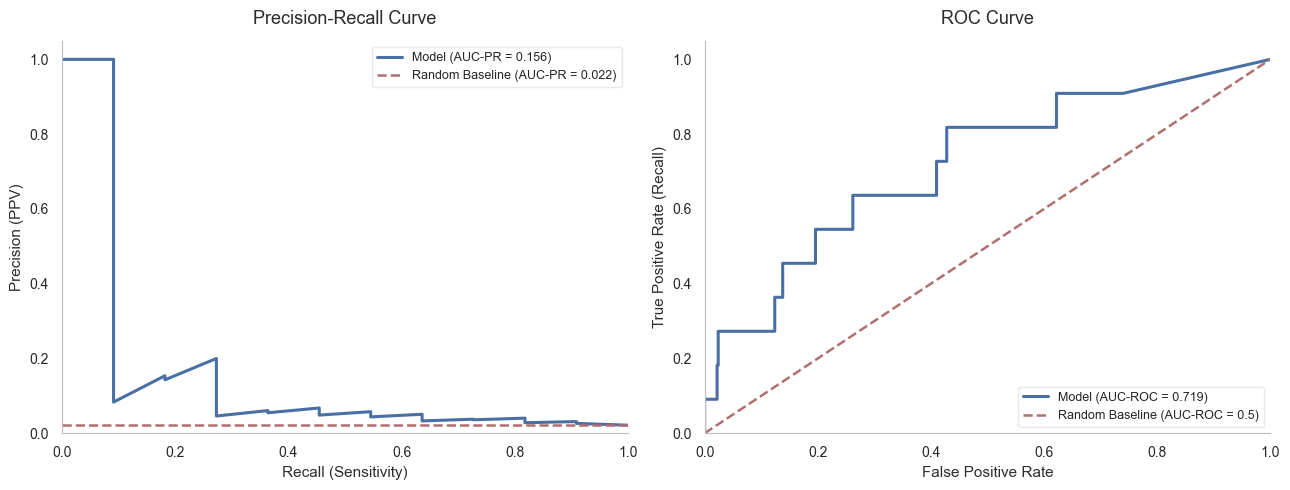
The classifier is a Random Forest, trained with class weighting because the high-risk group is
rare, and evaluated with stratified cross-validation so the rare class is represented in every
fold. The cover shows the precision-recall and ROC curves, which matter more than raw accuracy
when the positive class is small.
What predicts risk
Reading the model with both impurity-based and permutation importance, comorbidity burden came
out as the most reliable driver, ahead of features that are often assumed to matter. The useful
takeaway is that routine clinical data already carries most of the signal, so a scoring tool can
run on data a hospital already holds.
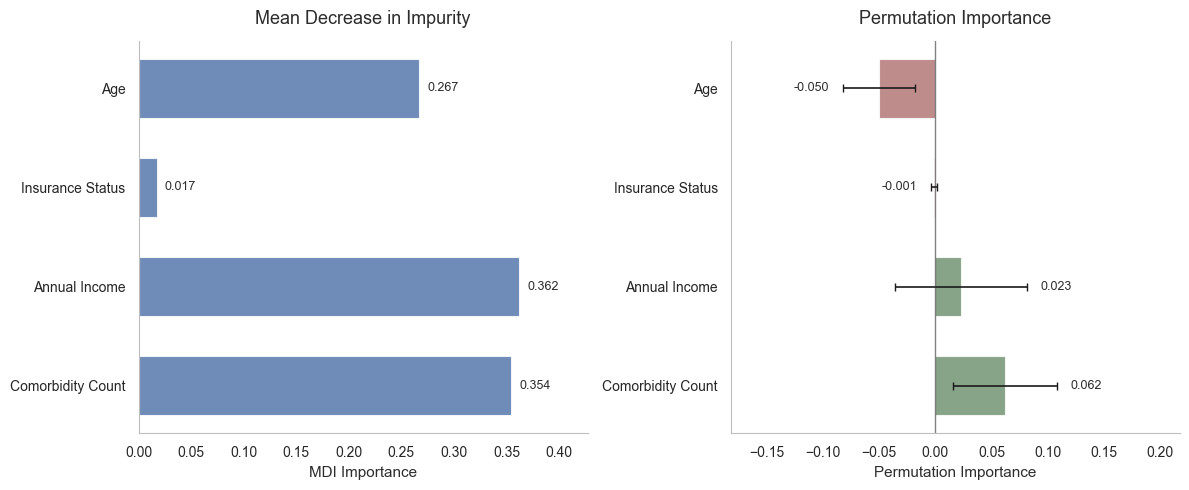
Figure 1. Feature importance by impurity and by permutation. Comorbidity burden leads on
both, which is the more trustworthy signal.
Performance
Ranked by predicted risk, the model identifies the high-risk group far better than the baseline,
a roughly 9.4-fold lift at the top of the ranking. The confusion matrix shows where it still
confuses the two groups, which is the cost a billing team would weigh against the saving.
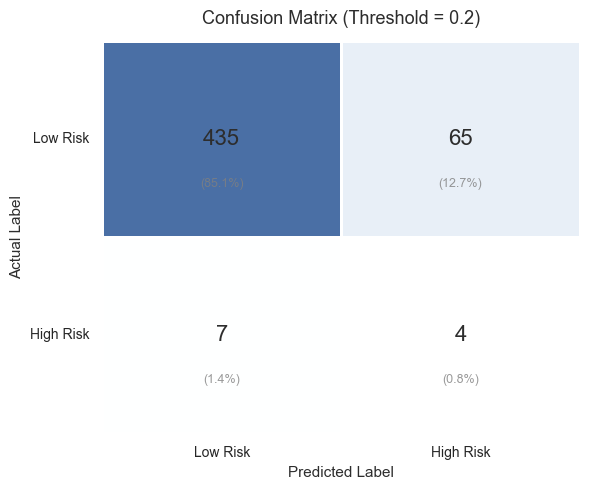
Figure 2. Confusion matrix. It makes the trade-off explicit: how many genuinely at-risk
patients are caught against how many are flagged unnecessarily.
Notes
The data are synthetic, so this is a demonstration of the modelling and evaluation rather than a
validated clinical or financial tool. The full pipeline, from data generation to feature
importance, is in the
repository.